OCFMA Benchmarking Report
updated April 2024
 Each year, OCFMA releases a report to summarize operations for the Ontario College sector. Each of the province’s 24 Colleges is responsible for submitting their report data in late summer. The data are then compiled, analyzed, reviewed and published into a report the following spring.
The report is used by Executives to monitor trends in the College sector. Facilities Leaders use the report to compare their institution’s indicators to prior years and against College peers to seek best practice opportunities.
![]() Report Data Templates, Annual Reports and Companion Data files are available on our document repository site on BoardEffect. Visit the Become a Member section of our website to inquire about how Members can access this resource.
Report Data Templates, Annual Reports and Companion Data files are available on our document repository site on BoardEffect. Visit the Become a Member section of our website to inquire about how Members can access this resource.
What is in the Report
The report is broken into 3 sections
- System Metrics – aggregated statistics for the College sector
- Cluster Comparisons – grouped measures comparing similar sized Colleges
- College Comparisons – key indicators ranking individual Colleges
Key metrics include:
- Trends in Total System Operating Costs
 College Space & Enrolment Growth
- Utility Trends
 Greenhouse Gas Emissions
 The report is also accompanied by a companion data file that includes 5-years of detailed, historical data used to generate the report. It is made available to those interested in digging for deeper insights from the report.
Findings from the most recent report (April 29, 2024):
Executive Summary 2022/23
- 23 of 24 Colleges reported for the period between Apr. 1, 2022 and Mar. 31, 2023. Northern College data was unavailable and will be added to subsequent reports, when available. Calculated estimates were used for aggregated comparisons and will be updated upon receipt of their data.
FINDINGS
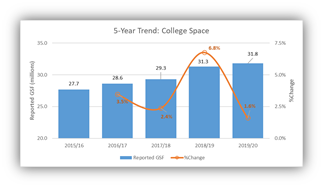
- Across all Colleges, space has increased slightly by +0.2M square feet (+0.6%) to 33.0M.
- College space experienced a minor bump in growth of 0.9% – exclusively among Medium Colleges. Large and Small Colleges did not register any space growth.
- Overall Student WFU (weighted funding unit) enrolment decreased 7.0%, its lowest level in 5-years, to 229,539.
- The average enrolment declined 7.0% last year. Large Colleges experienced the largest decrease at -8.2% compared to Medium Colleges at -6.9% and Small Colleges at -2.2%.
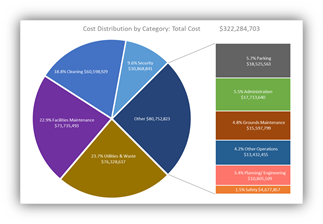
- The total operating costs across the Ontario Colleges increased by $28.7M (9.8%) versus last year to $321M.
- The $28.7M (9.8%) increase in system-wide operating costs was driven primarily by a $12.8M (17.8%) increase in Facilities Maintenance, a $10.9M (21.4%) increase in Cleaning and a $6.2M (9.9%) increase in Utilities & Waste.
- These increases were offset by decreased spending in Security of $4.7M (-14.5%), and Other Operations of $3.6M (-35.6%).
- Facilities Maintenance had the greatest single impact on the system-wide facilities costs accounting for 26% of the total costs. Utilities & Waste expenditures followed at 22%.
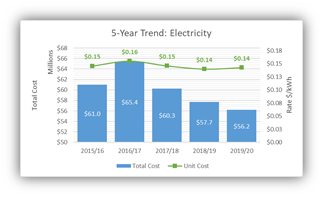
- Overall utilities costs (excluding waste) increased by $5.7M (+9.3%) to $67M.
- Electricity represents 68% of total utility costs. Total costs for electricity increased by $1.3M (2.9%) versus last year. The +3.8% increase in consumption was offset by an average decrease in electricity rates by -0.9%. Although the cooling season was milder than the prior year, post-COVID occupancy levels have likely fully returned thus driving increased usage.
- Natural Gas expenditures increased by +26.7% due to a +2.0% increase in consumption coupled with a +26.7% average rate increase to $0.41/m3. Although there were fewer heating days, the carbon tax has contributed to significant rate increases – exceeding 20% for the last 2 seasons.
- Total Water expenditures have increased by $1.2M (+25.2%) since last year due to a +31.6% increase in consumption. Water/ Sewer rates have reduced by 4.8% during this period to $4.19.
How to prepare the report data template
![]()
A new report template is used each year to collect data for each College. It contains improvements from previous files and adjustments for the upcoming report.
The Report Data Template file can be retrieved from BoardEffect (requires log-in).
Steps
- Log into BoardEffect,
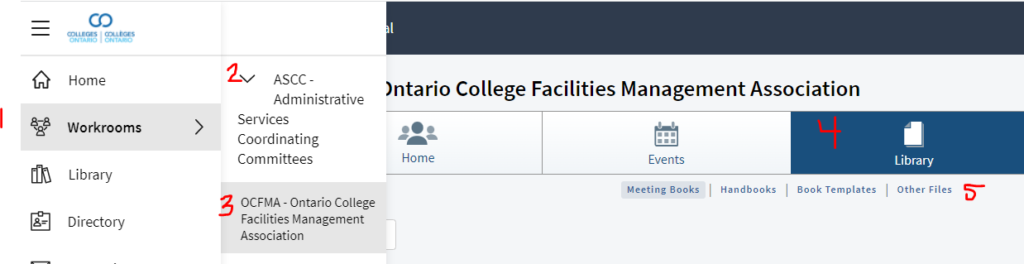
- From the dropdown menu on the left column, select ‘Workrooms’ then ‘ASCC – Administrative’,
- Select ‘OCFMA…’
- Click the ‘Library’ button on the top menu,
- Select the ‘Other Files’ hyperlink below the Library button.
- Next, scroll down and open the ‘OCFMA Benchmarking Reports’ folder
- Click the ‘OCFMA Benchmarking Report Data Template’ file and save to your local drive.
- Uncompress the new file, open and follow the instructions to complete the forms.
- Once complete, return the file by clicking ‘Submit Via Email’ from the ‘Submit’ worksheet or, email directly to r_mcevoy@Fanshawec.ca.
Files are due each year by Aug. 31.